NEW YORK, Feb. 28, 2026
Bitcoin traded near $66,700 late Saturday after slipping below a closely watched weekly 200EMA, putting the 200-week moving average, a level many long-term investors treat as bitcoin’s ultimate value zone, back in focus.
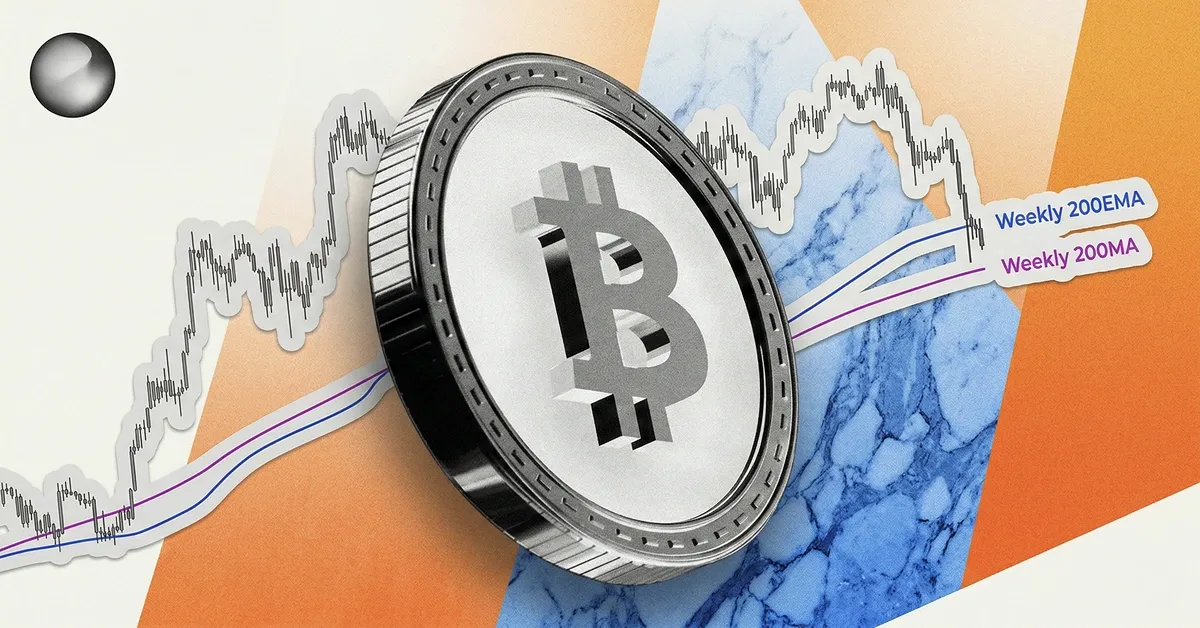
Bitcoin slips below weekly 200EMA as the 200-week MA draws attention
The move is less about a single headline and more about where bitcoin sits in its long-term trend. On a weekly chart, traders often watch the 200-period exponential moving average as a faster signal line, and the 200-week moving average as the deeper “value” reference.
Bitcoin (BTC) - 2-week price snapshot
BTCThe fear and greed index printed 11 on Feb. 28, a reading labeled Extreme Fear, showing the aftermath of a major selloff. Blackrock-linked bitcoin flow headlines also dominated the market chatter, even as spot price action remained range-like after early-February volatility.
Fear & Greed Index
Based on weekly closing data, the 200-week EMA is around $68,100 and the 200-week simple moving average around $58,400 as of the week ending Feb. 22. That leaves bitcoin slightly below the EMA line, but still roughly 14% above the longer-term average.

Bitcoin weekly chart highlighting the 200-week EMA and 200-week moving average.
The distinction matters mechanically. An exponential moving average weights recent prices more than a simple moving average, so a loss of the weekly 200EMA can show up before the slower 200-week average is threatened.
The 200-week moving average is Bitcoin’s long-term value zone
The weekly 200MA has earned its reputation because it tends to converge with periods when leverage has been flushed and long-term holders begin to treat price as “value” rather than momentum. It is not a magic floor, but it has historically been a level that changes how investors frame risk.
Even in the 2022 bear market, bitcoin’s deepest weekly close was not a collapse through the long-term average for years. Based on the same weekly close framework, bitcoin’s November 2022 low closed around $16,280, about 32% below its then-200-week moving average.
In other words, the level can be breached, but the breach has tended to be a late-cycle condition rather than the start of a prolonged multi-year downtrend. On recent history, that is why traders describe the weekly 200MA as an “ultimate” value zone even when sentiment is ugly.
That long-term framing can also interact with network fundamentals. Mining stress and market stress can arrive in the same month for different reasons, including episodes like a winter-storm-driven hashrate drop that tightened margins and raised questions about operational resilience.
BlackRock flow chatter and what to watch next
Another layer of the narrative came from institutional plumbing. A widely shared claim said BlackRock “dumped” about $32.7 million in bitcoin, but it was not immediately clear from public issuer disclosures what dataset the number referred to, or whether it reflected a single session of ETF net outflows rather than discretionary selling by the firm itself. BlackRock’s IBIT product page does not provide real-time context for social-media flow screenshots.
The messaging split is familiar in drawdowns around major levels. Bears have kept calling for deeper downside, while bulls argue that loud fear narratives often coincide with choppy two-way trade, the kind of market that ranges until positioning resets.
After bitcoin revisited the low-$60,000s earlier this month, directional calls grew louder, but price action has largely churned instead of cascading in a straight line. That is the kind of environment where the market can keep punishing certainty, and where the slow-moving weekly 200MA becomes a reference for longer-horizon allocators rather than a “timing” tool.
For bitcoin, the near-term question is whether the market reclaims the weekly 200EMA on a weekly close, or whether sellers press the move far enough that the slower 200-week MA becomes the next widely watched magnet. In parallel, watch whether fear-based narratives fade, whether spot volume returns, and how institutions expand access channels, including the push by large U.S. banks exploring bitcoin products as the market tries to stabilize.
Stay up to date
Get the latest crypto insights delivered to your inbox
Primary sources and further reading
| Source | Title |
|---|---|
| | CryptoCompare: Bitcoin (BTC) overview |
| | Alternative.me: Crypto Fear & Greed Index |
| | Investopedia: Exponential moving average (EMA) |
| | BlackRock: iShares Bitcoin Trust ETF (IBIT) product page |
Fact-checked by: Daily Crypto Briefs Fact-Check Desk
Frequently Asked Questions
What is Bitcoin’s 200-week moving average?
It is the average of bitcoin’s weekly closing prices over the past 200 weeks, a long-window trend gauge technicians often treat as a deep support reference.
What is the difference between a 200-week MA and a 200-week EMA?
A simple moving average treats each weekly close equally, while an exponential moving average weights recent closes more heavily, so it tends to react faster to new trends.
Does losing the weekly 200EMA guarantee deeper downside?
No. A break can be a warning signal, but technicians typically look for confirmation in weekly closes, spot flows, and broader liquidity conditions.
What does Fear & Greed Index 11 mean?
A reading of 11 is labeled “Extreme Fear,” indicating stressed sentiment. The index is not a standalone buy or sell signal.
What should investors watch next?
Watch whether bitcoin can reclaim the weekly 200EMA on a weekly close and whether the 200-week moving average comes into play, alongside ETF flow headlines and upcoming macro data.